
Compensation, continuous monitoring due to the nature of the materials used is a necessary issue. After the compensation systems are installed in the enterprises, whether this established system fully fulfils its function regularly should be monitored as follows.
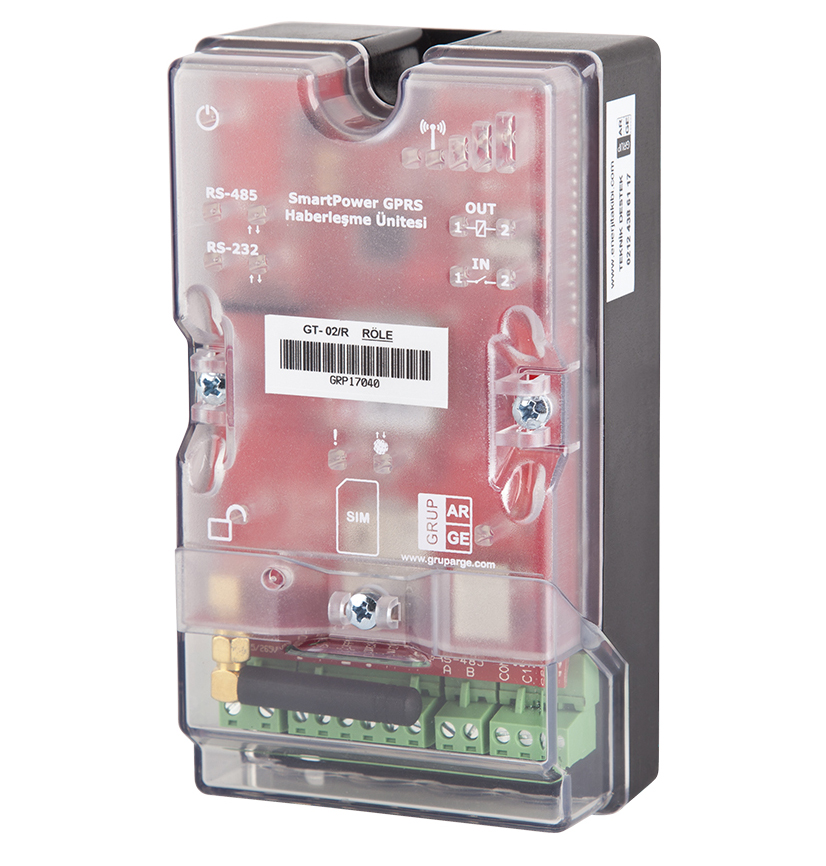
How it works
Smart Power Electricity meter if you want with remote monitoring systems, If you want, you can follow the Smart SVC compensation relay. In both systems also follow your businesses on a web-based basis without any programme installation you can track. The device you will install in the business you want to follow, with a counter or communicates with the relay and sends the data to the central server. You can also use the web site You can follow the status of businesses by logging into the SmartPower system. Even if you do not log in to the system, you can receive e-mail and e-mail messages in the alarm situations you define. You will be notified via SMS. Data from counters and relays in the field The devices that are collected are called 'SmartPower Client'. These devices can be used both with the meter both via optical port and RS-485, also via relay via RS-485 can communicate. According to the way of connecting to the Internet, GPRS and ETHERNET 2 different models are available.
Graphics
Business data are visualised and presented in graphs. Thus, you can more easily get an impression of the general situation of the business.
Long Term Recording
All energy values of the last 1 year are recorded in the system.
E-mail and SMS Alerts
When the determined inductive/capacitive ratio is exceeded, e-mail and SMS warnings are sent to the relevant persons.
Data Security
It stores data as a precaution against interruptions in the Internet connection and sends this data to the server when the connection is re-established.
Measured Parameters
Voltage, Current, Active Power, Reactive Power, Apparent Power, Inductive and Capacitive Ratios.
Tier Test
You can see the current values of the current stages in operation, you can have a remote stage test at any time. You can select the steps as a whole or individually.
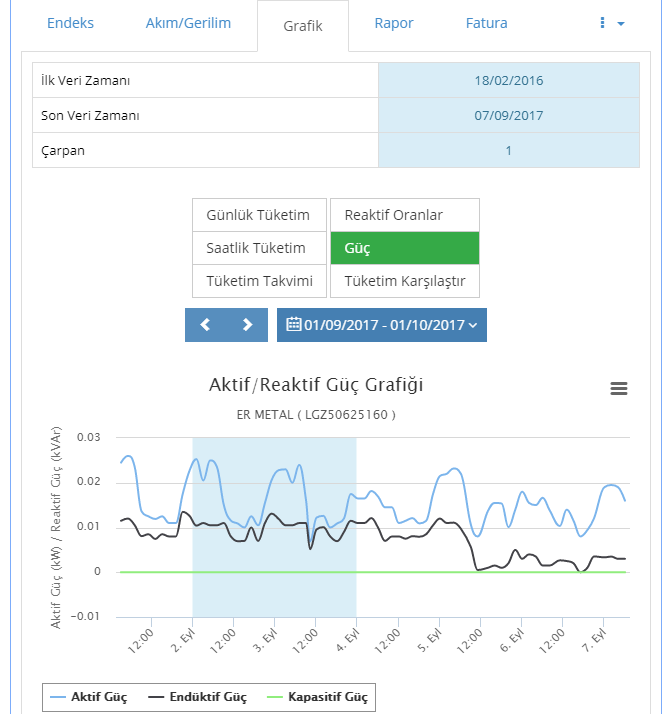
Power Flow Graph
The reactive energy used by your business is recorded together with its duration. Thanks to the Power Flow Graph, you can easily analyse your business and make the right step selection.
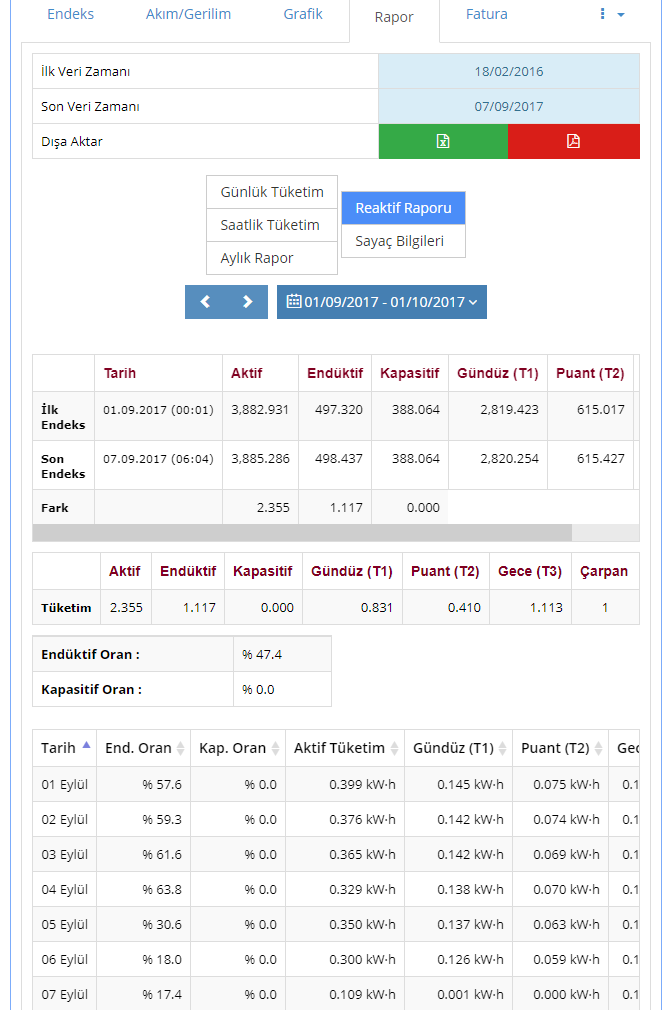
Reporting
All energy parameters and inductive/capacitive ratios between the desired dates can be reported. You can save these reports to your computer and print them.